Profiling C++ Extensions with Yep
06 Dec 2013Intro
For those of you who work with both the python codebase and the c++
backend, I found a pretty useful tool. Seeing as we work with
performance-sensitive software, profiling is very useful; but, it can be
a pain to profile our c++ code when called through python, which
necessitates writing c++ wrappers to functions for basic profiling.
The solution I found is called
yep,
which is a python module made specifically to profile c++ python
extensions.
Installation
In order to install, simply run:
sudo apt-get install google-perftools
sudo apt-get install python-dbg
pip install yep
For khmer, you should also be sure to turn on debugging at compile time:
cd /path/to/khmer
make debug
The first is the python module implementing the profiler; the second is the tool for analyzing the resulting profile information.
Usage
There are a couple ways to use it. You can call it directly from the command line with:
python -m yep [options] -- /path/to/script [args ... ]The -- is necessary, as it tells UNIX not to parse the resulting
arguments as flag arguments, which allows the profiler to pass them on
to the script being profiled instead of choking on them itself. Thanks
for this trick, @mr-c. Also make sure to use the absolute path to the
script to be profiled.
You can also use the module directly in your code, with:
import yep
yep.start('outname')
# <code to profile...>
yep.stop()
The resulting file is then visualized using google-pprof, with:
google-pprof --gif <python executable> <profile> > prof.gifIn order to get python debugging symbols, you need to use the debugging executable. So, while you may run the script in your virtualenv if using one, you give google-pprof the debug executable so it can properly construct callgraphs:
python -m yep -- /w/khmer/scripts/sweep-reads-by-partition-buffered.py \
 -k 25 -x 1e9 -o test_sweep -i /w/tests/test-sweep-contigs.fp \
/w/tests/test-sweep-reads.fa
google-pprof --gif /usr/bin/python2.7-dbg \
 sweep-reads-by-partition-buffer.py.prof > prof.gif
Results
Here is some example output:
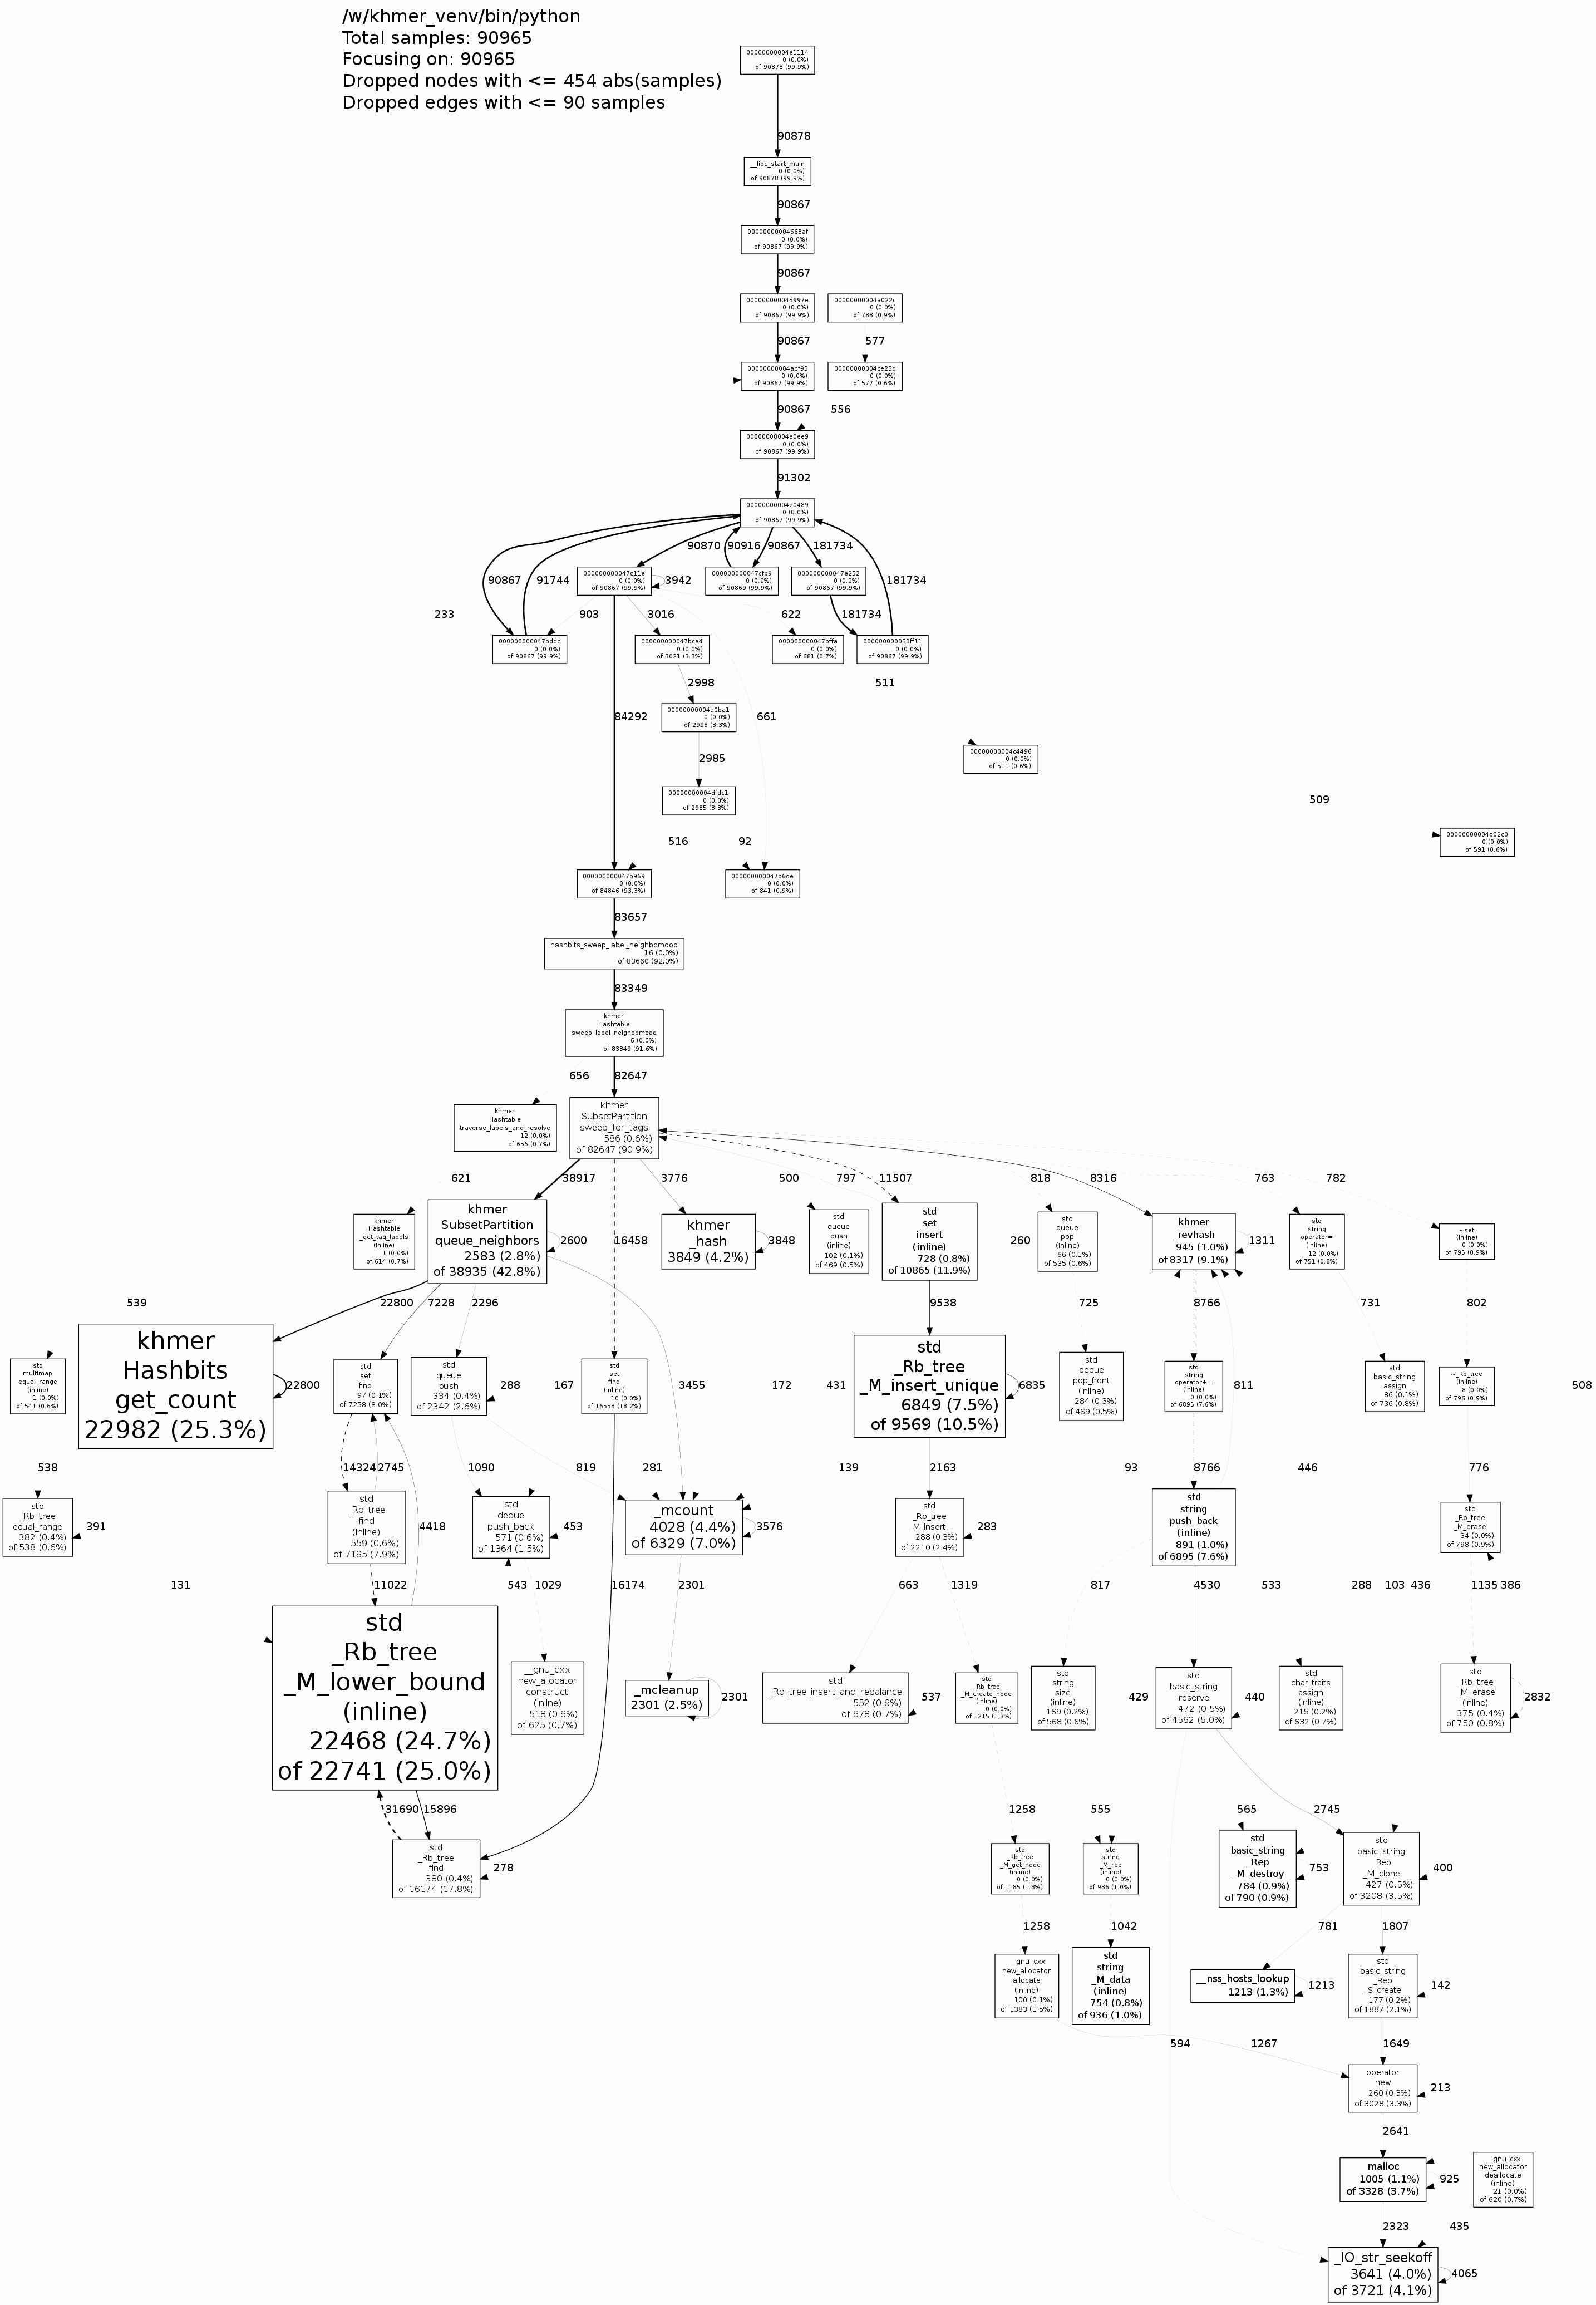
In this call graph, the python debugging symbols were not properly included; this is resolved by using the debugging executable.
The call graph is in standard form, where the first percentage is the time in that particular function alone, and where the second percentage is the time in all functions called by that function. See the description for more details.
And that’s it. Happy profiling!